Nsight-systems#
Nsight Systems is a suite of profiling tools that replaces nvprof as CUDA releases progress. It provides a more detailed view of the workload than nvprof, and can be used to identify bottlenecks and optimize performance.
To collect the profiling information, submit a job as follows. This is the same job as above, but using Nsight Systems to profile and the machine learning module.
#!/bin/bash -l
#SABTCH --job-name=nsys
#SBATCH --time=00:30:00
#SBATCH --gres=gpu:1
#SBATCH --constraint=v100
#SBATCH --ntasks=1
#SBATCH --cpus-per-task=8
#SBATCH --partition=batch
#SBATCH --mail-type=ALL
#SBATCH --output=%x-%j-slurm.out
#SBATCH --error=%x-%j-slurm.err

module load machine_learning/2023.04

cmd="python ./train_nvtx.py"
nsys profile --trace='cuda','cublas','cudnn','osrt' --stats='true' --sample=none --export=sqlite -o profile.${SLURM_JOBID} ${cmd}
The above jobscript launches our python training using nsys profiler. Notice that we are loading only the machine learning module. As options, the command line also accepts the tracers you would like to use to trace different API calls by your code. In the jobscript above, we are choosing to trace cuda,cublas,cudnn API calls, and also osrt or OS Runtime calls (e.g. I/O calls). --stats=true allows printing a concise report in your SLURM output file for quick examination. In addition to this, the jobscript also instructs nsys to export the output collected and a SQLlite database which the Nsight-systems visual tool can easily search.
Note
To launch the visualization of the profile on ibex glogin node (required OpenGL support)
nsight-sys profile.11264040.nsys-rep
Where profile.11264040.nsys-rep is our profile.

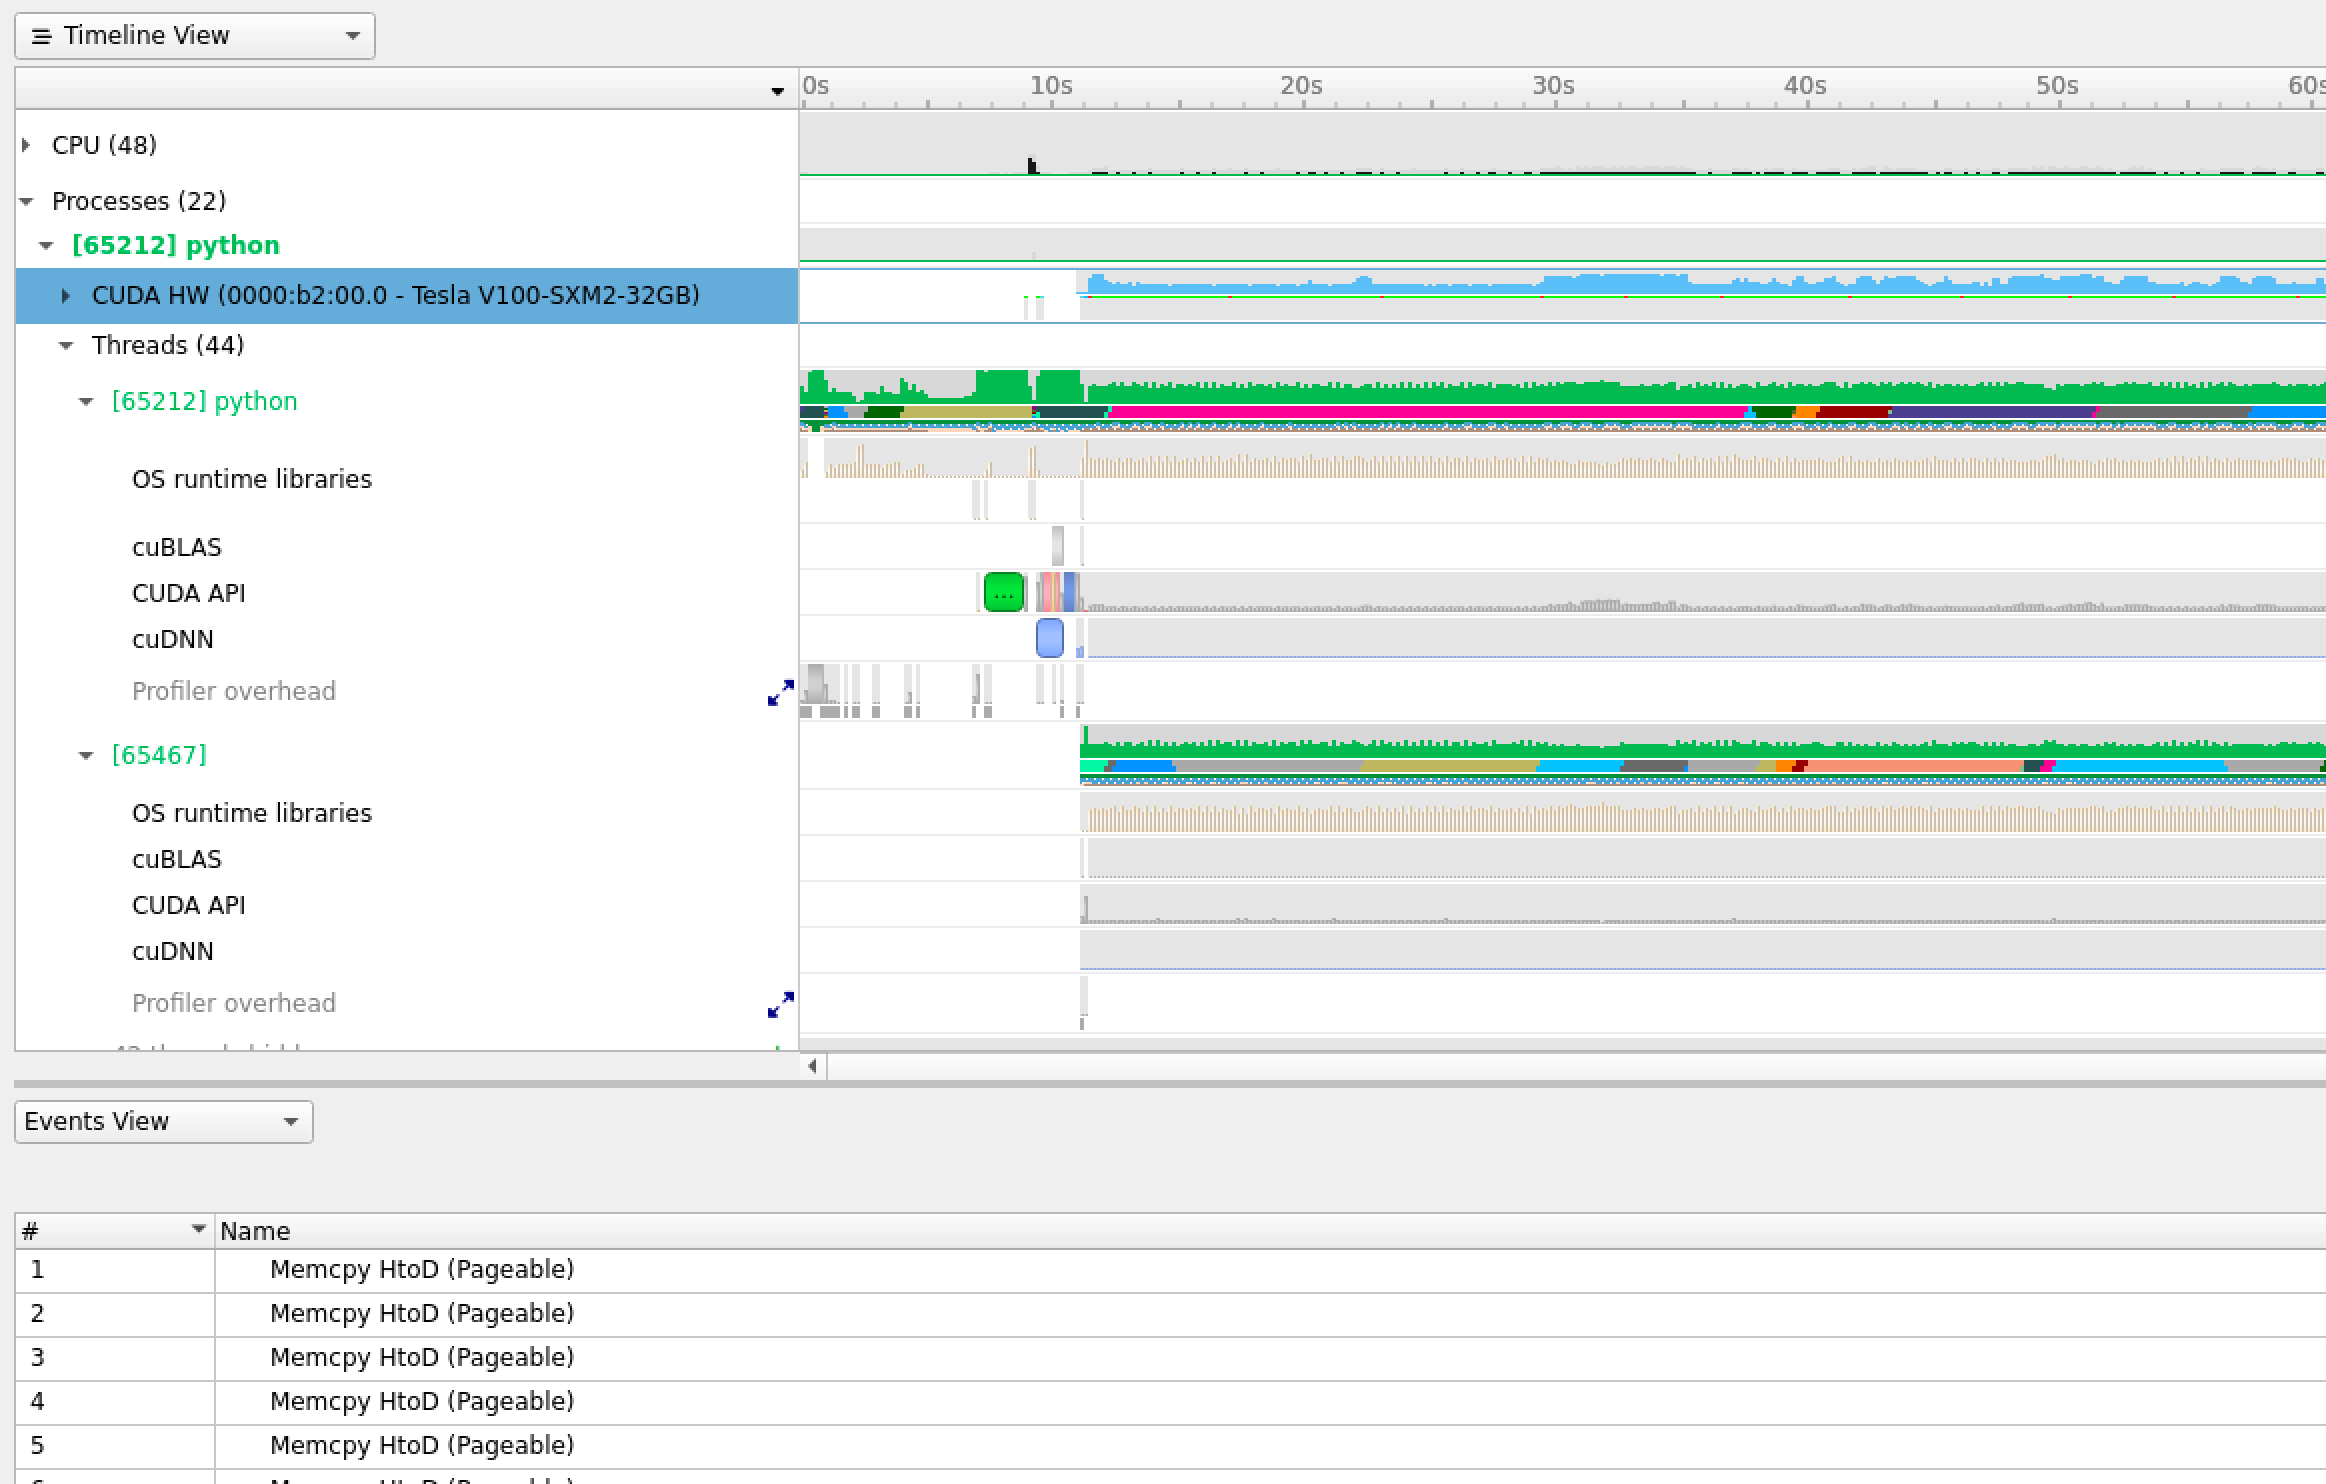
The output is a stacked time series of all the resources and events traced. Hover your mouse on the event profile bar of CUDA HW(0000:b2:00.0Tesla V100-SXM2-32GB) and you will notice how busy you GPU has been. The time series can be zoomed in to inspect the events at short time scales down to micro, even nanoseconds. You can expand the above tab to show more event in finer granularity to see timing and sequence of different kernels. (Right click on CUDA HW(0000:b2:00.0Tesla V100-SXM2-32GB) tab and choose Show in Events View to inspect the table of the kernels profiled).

Nsight-systems with NVTX instrumentation#
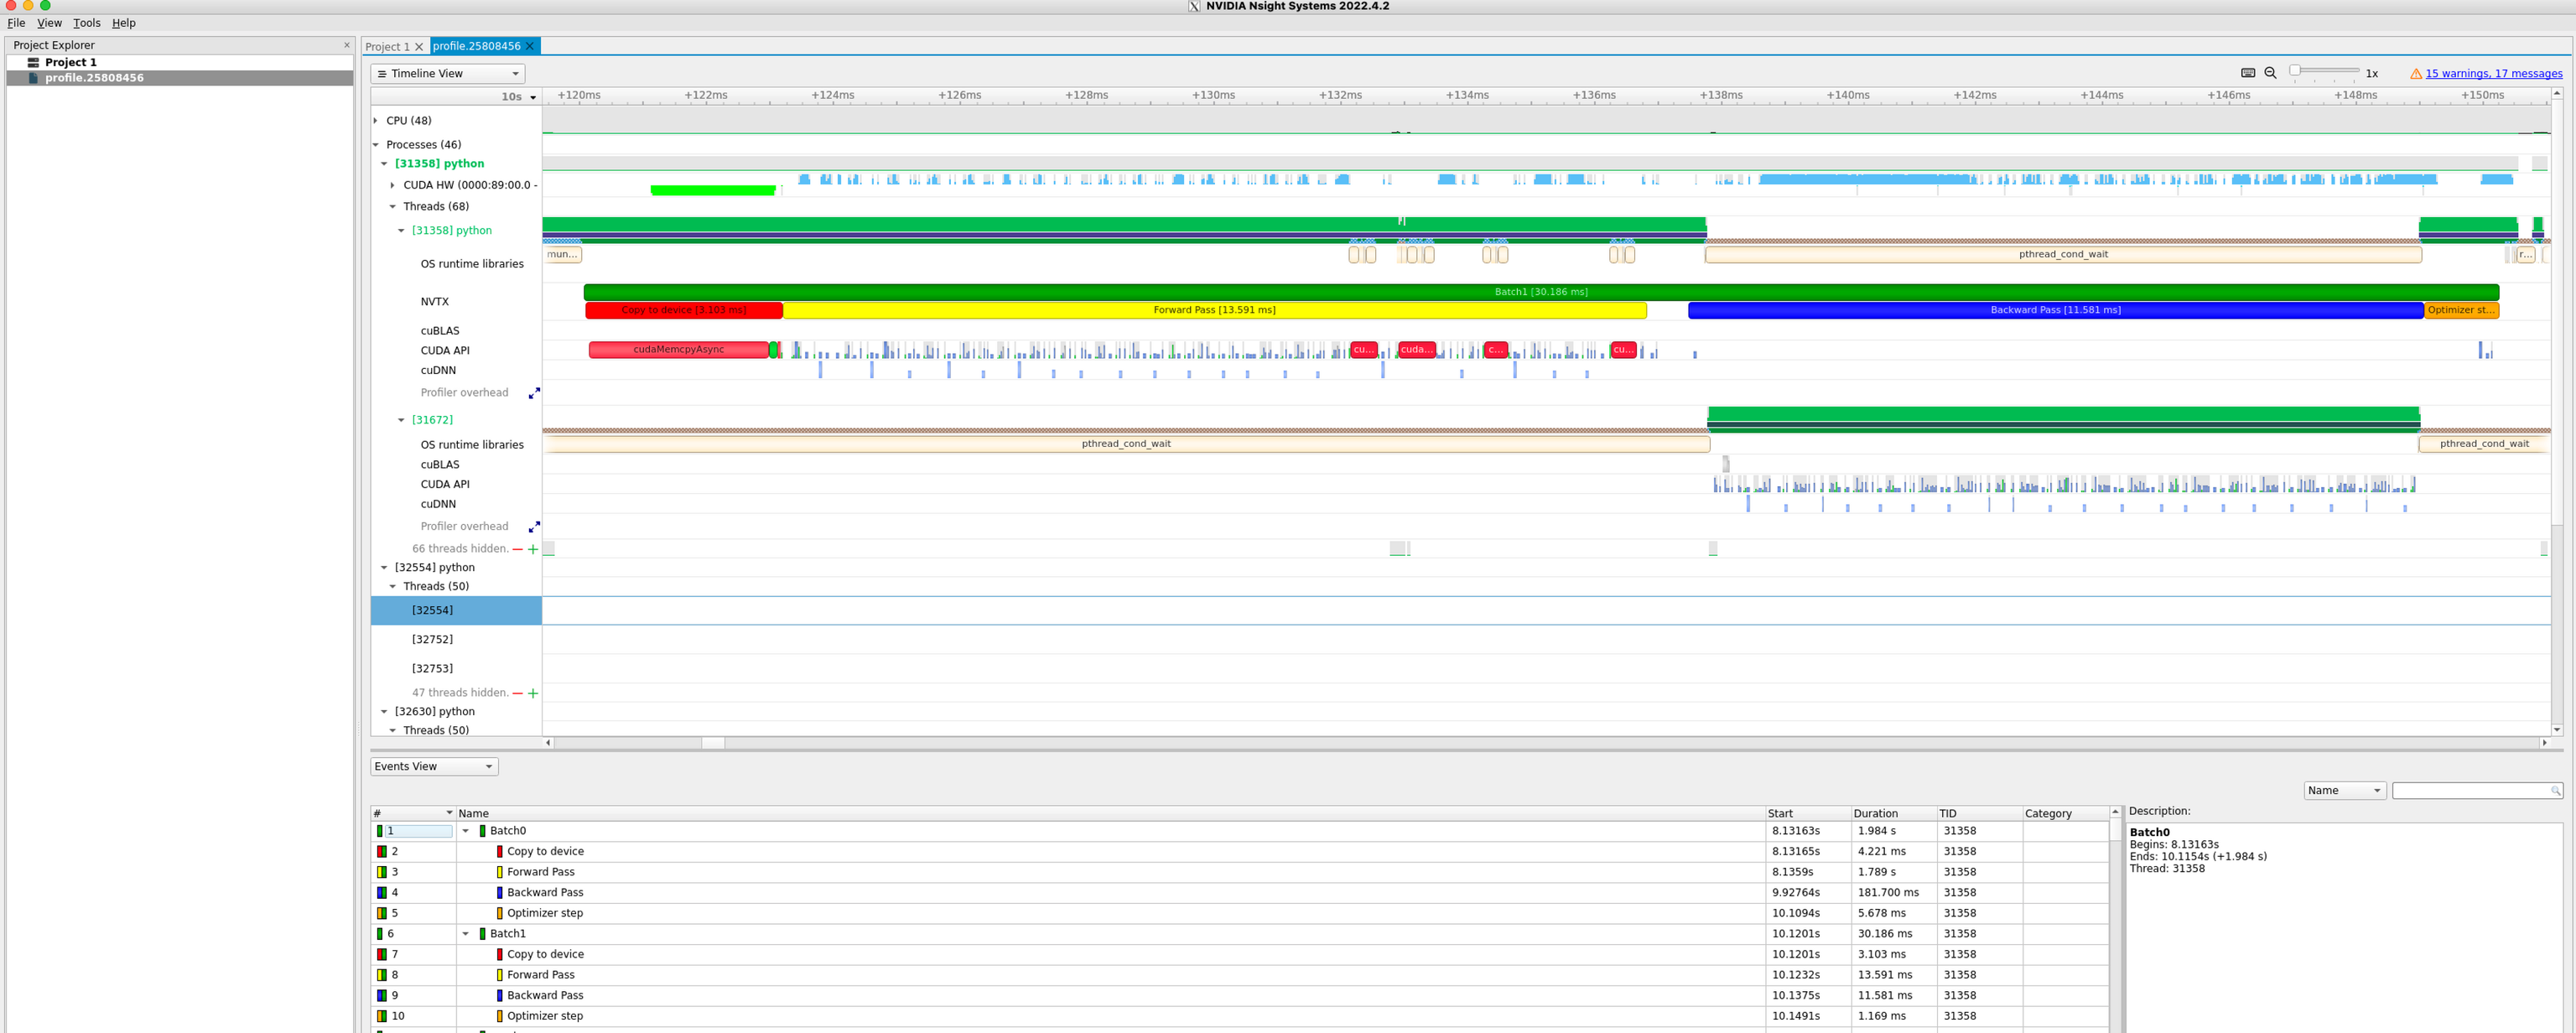
In a typical epoch of DL training, multiple mini-batches are trained, and often it is tricky to demarcate a mini-batch where it ends and the next one starts. NVIDIA Tools Extension or NVTX is a way to instrument your training script to annotate different operations of the training of a mini-batch. The code requires minimal change:
If you are using the machine learning model, you can directly add this line to your code
#load nvtx package
import nvtx
Annotate various operations of your training process
for epoch in range(5):
for i, (images, labels) in enumerate(train_loader):
    with nvtx.annotate("Batch" + str(i), color="green"):

        #load images and labels to device
        with nvtx.annotate("Copy to device", color="red"):
            images, labels = images.to(device), labels.to(device)

        # Forward pass
        with nvtx.annotate("Forward Pass", color="yellow"):
            outputs = model(images)

        # Calculate the loss
        loss = criterion(outputs, labels)

        # Backpropagate the loss
        optimizer.zero_grad()

        with nvtx.annotate("Backward Pass", color="blue"):
            loss.backward()

        with nvtx.annotate("Optimizer step", color="orange"):
            optimizer.step()
To instruct nsys profiler to collect the annotated profile in the training loop, the launch command will add nvtx tracer.
nsys profile --trace='cuda','cublas','cudnn','osrt','nvtx' --stats='true' --sample=none --export=sqlite -o profile.${SLURM_JOBID} ${cmd}
Upon visualizing, you can see an annotated training profile that is easier to track with the labels and colors you selected on the script
