Using NVDashboard for monitoring GPU metrics on Ibex#
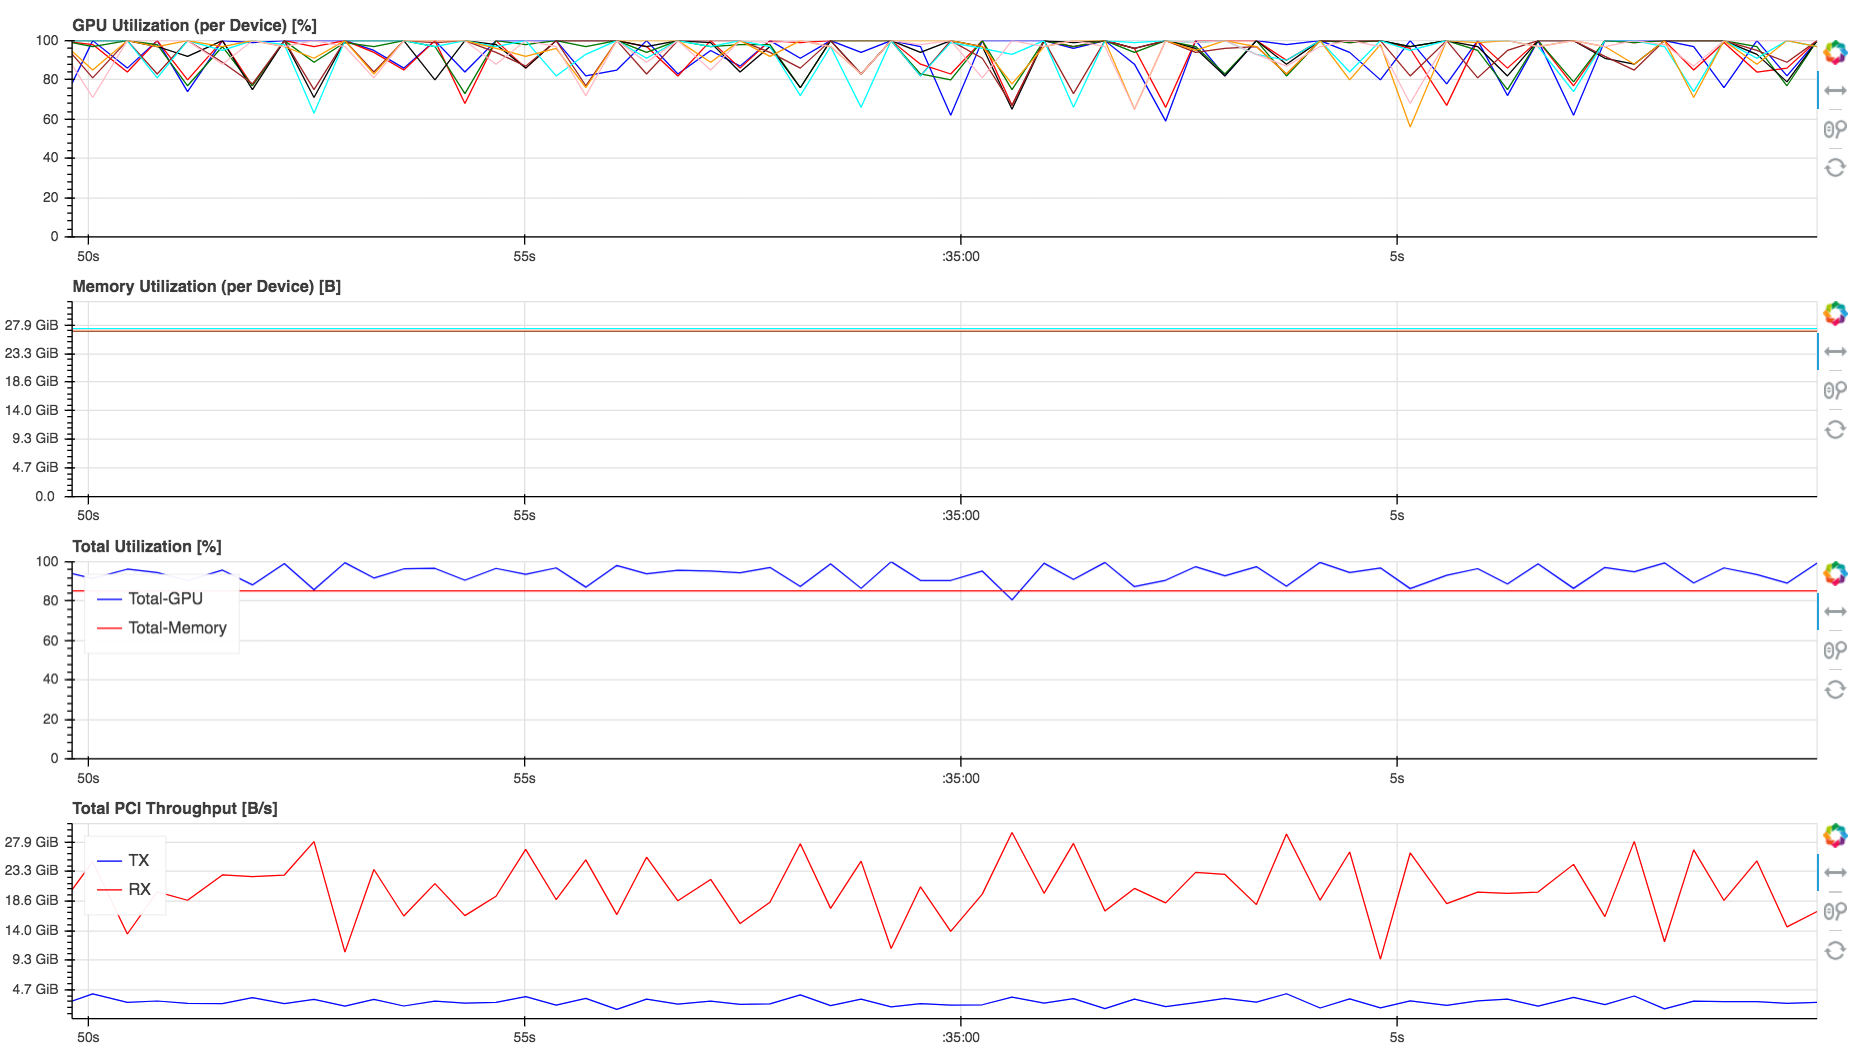
In some situations you may want to look at the real time utilization of the compute resources allocated to you. There are multiple way of doing this. NVIDIA published a neat solution which visualizes the time series output from nvidia-smi in a Bokeh dashboard. nvidia-smi uses nvml library to collect the metrics.
To install in your conda environment you can use `pip`:
pip install jupyterlab-nvdashboard
You can then launch the dashboard server in your jobscript:
#!/bin/bash
#SBATCH --gpus=1
#SBATCH --time=00:10:00
# Try different port if the following is occupied by another user

HOST=$(hostname)
nvdashboard_port=$(python -c 'import socket; s=socket.socket(); s.bind(("", 0)); print(s.getsockname()[1]); s.close()')
nvdashboard ${nvdashboard_port} &
echo "Copy the following command and paste it in new terminal:
ssh -L ${nvdashboard_port}:${HOST}:${nvdashboard_port} $USER@glogin.ibex.kaust.edu.sa"
sleep 5
python train.py
To connect to this server, you will first establish ssh tunnel to the compute node it your training job is running on. Please submit the job and read the instructions in the slurm output file for the steps to establish the `ssh` tunnel.
Once logged in, use the following URL in your browser to access the dashboard.
`<port-number>`#http://localhost:<port-number>

Important
It is important to note that `nvdashboard` utility is only useful to monitor the single or multiGPU telemetry on a single host/machine. This is a limitation of the tool.