Profiling a CUDA kernel written in Fortran using Nsight Systems#
Nsight Systems can be used to profile CUDA code.
The following C++ code adds two matrices and writes the result into a new matrix.
CUDA unified memory is used in the code.
This code can be saved in a file named matrix_add.cuf.
module myMath
contains
  ! Kernel declaration
  attributes(global) subroutine add_kernel(A, B, C, N)
    real, managed :: A(N, N), B(N, N), C(N, N)
    integer, value :: N
    integer :: i, j

    i = (blockIdx%x - 1) * blockDim%x + threadIdx%x
    j = (blockIdx%y - 1) * blockDim%y + threadIdx%y

    if (i <= N .and. j <= N) then
      C(i, j) = A(i, j) + B(i, j)
    end if
  end subroutine add_kernel
end module myMath

program matrix_add
  use myMath
  use cudafor
  implicit none

  integer :: istat
  integer, parameter :: N = 1024
  real, managed :: A(N, N), B(N, N), C(N, N)

  integer :: i, j
  type(dim3) :: gridDim, blockDim


  ! Initialize input matrices on host
  do j = 1, N
    do i = 1, N
      A(i, j) = 1.0
      B(i, j) = 2.0
    end do
  end do

  ! Define block and grid dimensions
  blockDim = dim3(16, 16, 1)
  gridDim  = dim3((N+15)/16, (N+15)/16, 1)

  ! Launch kernel
  call add_kernel<<<gridDim, blockDim>>>(A, B, C, N)
  istat = cudaDeviceSynchronize()

  ! Print a sample result
  print *, "Matrix addition complete."
  print *, "Result C(1:10,1:10):"
  do i = 1, min(N, 10)
    write(*, '(10F10.3)') (C(i, j), j = 1, min(N, 10))
  end do
end program matrix_add
The following SLURM job script compiles matrix_add.cuf, runs the Nsight Systems profiler, and collects performance data.
This script can be saved in a file named matrix_add.slurm.
#!/bin/bash -l
#SBATCH --time=00:10:00
#SBATCH --gres=gpu:1
#SBATCH --constraint=v100
module load nvidia-sdk
nvfortran -cuda -o matrix_add matrix_add.cuf
nsys profile -o profile.${SLURM_JOBID} matrix_add
The following steps show how to submit matrix_add.slurm on Ibex:
ssh glogin.ibex.kaust.edu.sa
sbatch matrix_add.slurm
The output of the profiler is recorded in a file named profile.<SLURM_JOBID>.nsys-rep.
This file can be copied to a local machine and examined.
The following command can be used to find out the version of the Nsight Systems:
nsys --version
The same version of the Nsight Systems can be downloaded from here to run on the local machine.
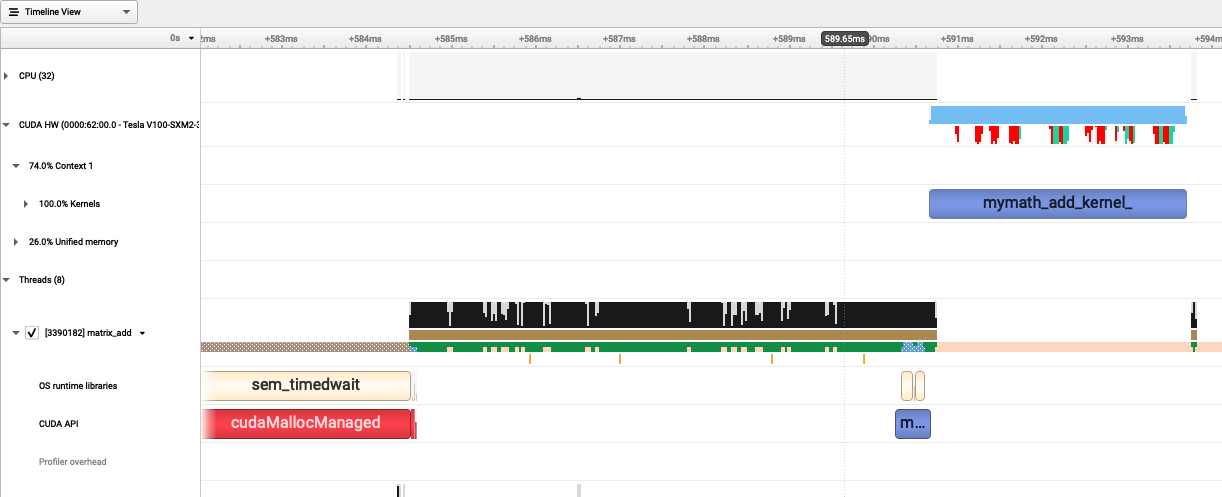
The following trace of execution shows the GPU device (V100) and a couple of CPU threads.
The two input matrices are allocated on the CPU memory (shown as cudaMallocManaged in red color) and initialized on the CPU.
During the execution of the CUDA kernel for matrix addition, host-to-device memory operations (colored in red and light green) are observed.
This is because unified memory is used and the kernel tries to access to the matrices on the host memory.
The duration of the kernel execution on the device is shown in blue.
In conclusion, the device must be kept busy with computations displayed as blue.
However, the data movements must be minimized or completely removed if possible.