Profiling an NVIDIA RAPIDS workflow using Nsight Systems#
This documentation explains how to profile a deep learning workload using RAPIDS cuML and Nsight Systems. Example scripts are available at this repository. See the src folder for rapids_tsne.py and rapids_tsne.sh.
Quick Start#
To collect profiling information, submit a job as follows. This is similar to the job in Nsight Systems with NVTX instrumentation, but uses Nsight Systems to profile a t-SNE dimensionality reduction with the RAPIDS cuML library.
#!/bin/bash
#SBATCH --job-name=Nsys_rapids_tsne
#SBATCH --output=rapids_tsne_output.%j.out
#SBATCH --error=rapids_tsne_error.%j.err
#SBATCH --time=00:30:00
#SBATCH --gres=gpu:1
#SBATCH --constraint=v100
#SBATCH --ntasks=1
#SBATCH --cpus-per-task=8

module load machine_learning
module load nvidia-sdk/nvhpc/25.5

# Run the RAPIDS t-SNE script with Nsight Systems profiling
cmd="python ./rapids_tsne.py"
nsys profile --trace='cuda','cublas','cudnn','osrt','nvtx' --stats=true --sample=none --export=sqlite -o profile.${SLURM_JOBID} ${cmd}
The above job script launches Python training with the nsys profiler. We load the machine learning and NVIDIA SDK modules. The command line options allow you to select which API calls to trace. In this example, we trace cuda, cublas, cudnn, and osrt (OS Runtime, e.g., I/O calls). --stats=true prints a concise report in your SLURM output file. The job script also exports the collected output and a SQLite database for easy searching in the Nsight Systems visual tool.
Note
To launch the visualization of the profile on the Ibex glogin node (requires OpenGL support), use:
nsys-ui profile.40118944.nsys-rep
Where profile.40118944.nsys-rep is your profile output file.
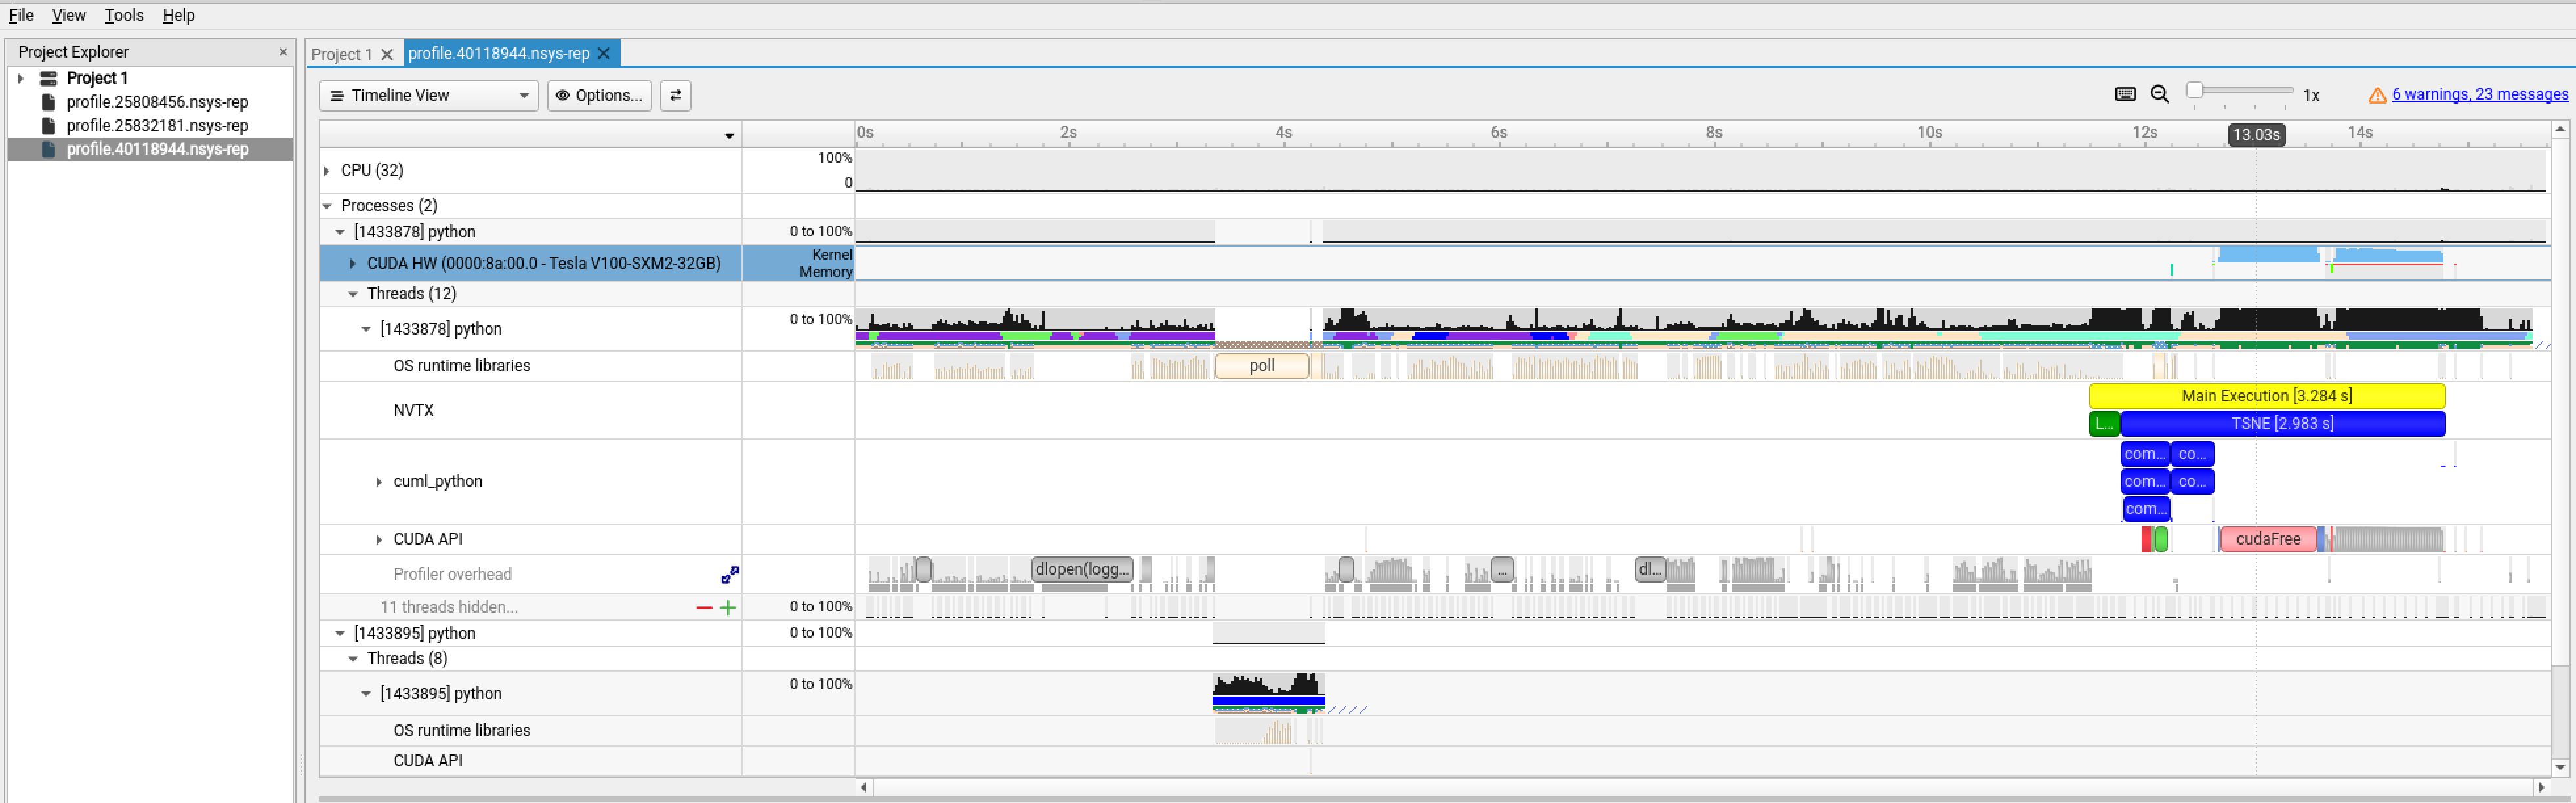
The output is a stacked time series of all resources and events traced. Hover your mouse over the event profile bar of CUDA HW(0000:8a:00.0-Tesla V100-SXM2-32GB) to see how busy your GPU has been. You can zoom in to inspect events at micro- or nanosecond scales. Expand the tab to show more events in finer granularity and see the timing and sequence of different kernels. (Right-click on CUDA HW(0000:b2:00.0-Tesla V100-SXM2-32GB) and choose Show in Events View to inspect the table of kernels profiled).
Adding NVTX Instrumentation#
NVIDIA Tools Extension (NVTX) allows you to instrument your training script to annotate different operations. The code requires minimal changes:
If you are using a machine learning model, add this line to your code:
# Load nvtx package
import nvtx
You can annotate various operations in your training process. Decorate complete functions or use the context manager to annotate a block of code. For example, to annotate a function:
# Use the nvtx package to annotate the t-SNE operation for profiling
@nvtx.annotate("TSNE", color="blue")
def run_tsne(X, n_components=2, perplexity=30.0, n_iter=1000):
    """
    Run t-SNE on the dataset using RAPIDS cuML implementation.
    Parameters:
        X: Input data
        n_components: Number of dimensions for embedding
        perplexity: t-SNE perplexity parameter
        n_iter: Number of optimization iterations
    Returns:
        Embedded data in lower dimensions
    Note:
        Number of Nearest Neighbors should be at least 3 * perplexity.
    """
    n_neighbors = max(90, int(3 * perplexity))  # Ensure n_neighbors >= 3 * perplexity
    tsne = TSNE(n_components=n_components, perplexity=perplexity, n_iter=n_iter,
                random_state=23, method='fft', n_neighbors=n_neighbors)
    X_embedded = tsne.fit_transform(X)
    return X_embedded
Alternatively, use the context manager to annotate a block of code:
with nvtx.annotate("Main Execution", color="yellow"):
    # Load the Fashion-MNIST dataset from the specified directory
    X, y = load_mnist_train('data/fashion')

    # Run t-SNE dimensionality reduction on the dataset
    X_embedded = run_tsne(X, n_components=2, perplexity=30.0, n_iter=1000)

    # Print the shape of the embedded data and the first 5 points for inspection
    print("Shape of embedded data:", X_embedded.shape)
    print("First 5 embedded points:\n", X_embedded[:5])