Profiling a single-GPU PyTorch training workload using NVIDIA Nsight Systems#
This guide demonstrates how to profile a PyTorch training workload running on a single GPU using NVIDIA Nsight Systems. Profiling helps identify performance bottlenecks and optimize the training process. While this example uses a single V100 GPU on the IBEX cluster, the same approach applies to other NVIDIA GPUs.
Here is a sample PyTorch training script (singlegpu.py) that trains an image classifier on the Tiny ImageNet dataset using a single GPU. The script includes NVTX ranges to mark different sections of the code for profiling.
#!/usr/bin/env python
# Functions for capturing time elapsed
import time, gc

# Timing utilities
start_time = None

def start_timer():
    global start_time
    gc.collect()
    if device == "cuda":
        torch.cuda.empty_cache()
        torch.cuda.reset_max_memory_allocated()
        torch.cuda.synchronize()
    start_time = time.time()

def end_timer_and_print(local_msg):
    if device == "cuda":
        torch.cuda.synchronize()
    end_time = time.time()
    print("\n" + local_msg)
    print("Total execution time = {:.3f} sec".format(end_time - start_time))
    print(
        "Max memory used by tensors = {} bytes".format(
            torch.cuda.max_memory_allocated()
        )
    )

import torch, datetime, os

# Essential packages for training an image classifier in PyTorch
import torch.nn.functional as F
import torch.nn as nn
import torch.optim as optim
import torch.backends.cudnn as cudnn
from torch.cuda import amp

import torchvision
import torchvision.transforms as transforms
import matplotlib.pyplot as plt
import numpy as np

import torch.cuda.nvtx as nvtx

torch.manual_seed(43)
cudnn.deterministic = True
cudnn.benchmark = False

# import and instantiate tensorboard for monitoring model performance
from torch.utils.tensorboard import SummaryWriter

nodes = 1
gpus = 1
num_workers = 8
batch_size = 4
epochs = 1
lr = 1e-2
momentum = 0.9
weight_decay = 5e-4
print_interval = 100

def accuracy(outputs, labels):
    preds = outputs.argmax(dim=1)
    return torch.sum(preds == labels).item()


with nvtx.range("dataprep"):
    # Prepare training data
    normalize = transforms.Normalize(
        mean=[0.485, 0.456, 0.406], std=[0.229, 0.224, 0.225]
    )
    train_transform = transforms.Compose(
        [
            transforms.RandomResizedCrop(224),
            transforms.RandomHorizontalFlip(),
            transforms.ToTensor(),
            normalize,
        ]
    )

    val_transform = transforms.Compose(
        [
            transforms.Resize(256),
            transforms.CenterCrop(224),
            transforms.ToTensor(),
            normalize,
        ]
    )

    datadir = os.environ["DATA_DIR"]
    trainset = torchvision.datasets.ImageFolder(
        root=os.path.join(datadir, "train"), transform=train_transform
    )
    trainloader = torch.utils.data.DataLoader(
        trainset,
        batch_size=batch_size,
        shuffle=True,
        num_workers=num_workers,
        pin_memory=True,
        drop_last=False,
    )

    valset = torchvision.datasets.ImageFolder(
        root=os.path.join(datadir, "val"), transform=val_transform
    )
    valloader = torch.utils.data.DataLoader(
        valset,
        batch_size=batch_size,
        shuffle=False,
        num_workers=num_workers,
        pin_memory=True,
        drop_last=False,
    )

#with torch.autograd.profiler.emit_nvtx():
if True:
    # Pre-training
    net = torchvision.models.resnet50(weights=None, num_classes=200)
    # Transfer learning
    # net=torchvision.models.resnet50(weights=torchvision.models.ResNet50_Weights.IMAGENET1K_V2)

    if torch.cuda.is_available():
        device = "cuda"
        print(device)
        net.cuda(torch.cuda.current_device())
    else:
        device = "cpu"

    print(device)
    criterion = nn.CrossEntropyLoss().to(device)
    optimizer = optim.SGD(
        net.parameters(), lr=lr, momentum=momentum, weight_decay=weight_decay
    )
    scaler = amp.GradScaler()
    net.to(device)
    print("Starting the training")
    start_timer()
    writer = SummaryWriter("logs/experiment_%s" % (os.environ.get("SLURM_JOBID", "default")))
    for epoch in range(epochs):  # loop over the dataset multiple times
        with nvtx.range("training"):
            # Train loop
            net.train()
            train_loss = 0.0
            for i, data in enumerate(trainloader):
                # get the inputs; data is a list of [inputs, labels]
                inputs = data[0].to(device, non_blocking=True)
                labels = data[1].to(device, non_blocking=True)

                # zero the parameter gradients
                optimizer.zero_grad()

                # forward + backward + optimize
                with torch.cuda.amp.autocast(enabled=True, dtype=torch.float32):
                    outputs = net(inputs)
                    loss = criterion(outputs, labels)
                scaler.scale(loss).backward()
                scaler.step(optimizer)
                scaler.update()
                train_loss += loss.item()

            train_loss = train_loss / len(trainloader)
            writer.add_scalar("Loss/train", train_loss, epoch)

        with nvtx.range("validation"):
            # Validation loop ( we won't backprop and optimize since this step is not training the model)
            net.eval()
            val_loss = 0.0
            for i, data in enumerate(valloader):
                # get the inputs; data is a list of [inputs, labels]
                inputs = data[0].to(device, non_blocking=True)
                labels = data[1].to(device, non_blocking=True)
                with torch.no_grad():
                    outputs = net(inputs)
                    loss = criterion(outputs, labels)
                val_loss += loss.item()
            val_loss = val_loss / len(valloader)
            writer.add_scalar("Loss/val", val_loss, epoch)
            print(f"[{epoch + 1}] :Loss (train, val):{train_loss:.3f}, {val_loss:.3f}")
            writer.flush()

with nvtx.range("savemodel"):
    end_timer_and_print("Finished Training")
    writer.close()
    PATH = "./tiny_imagenet.pth"
    torch.save(net.state_dict(), PATH)
To profile the above PyTorch training script using NVIDIA Nsight Systems, you can use the following SLURM script (singlegpu.slurm) on IBEX:
#!/bin/bash

#SBATCH --time=00:30:00
#SBATCH --nodes=1
#SBATCH --ntasks=1
#SBATCH --ntasks-per-node=1
#SBATCH --gpus=1
#SBATCH --gpus-per-node=1
#SBATCH --constraint=v100
#SBATCH --cpus-per-task=8

module load dl
module load pytorch
module load nvidia-sdk/nvhpc/25.9
export DATA_DIR=/ibex/ai/reference/CV/tinyimagenet
cmd="python singlegpu.py"
nsys profile --force-overwrite true --cuda-memory-usage=true --trace=cuda,nvtx  --export=sqlite --output profile.${SLURM_JOBID} ${cmd} 2>&1 | tee output.txt
The above SLURM script can be submitted to the IBEX cluster using the following command:
sbatch singlegpu.slurm
After the job completes, you will find a profiling report file named profile.<SLURM_JOBID_OF_YOUR_JOB>.nsys-rep in your working directory. You can open this report using NVIDIA Nsight Systems GUI on your local machine to analyze the profiling data.
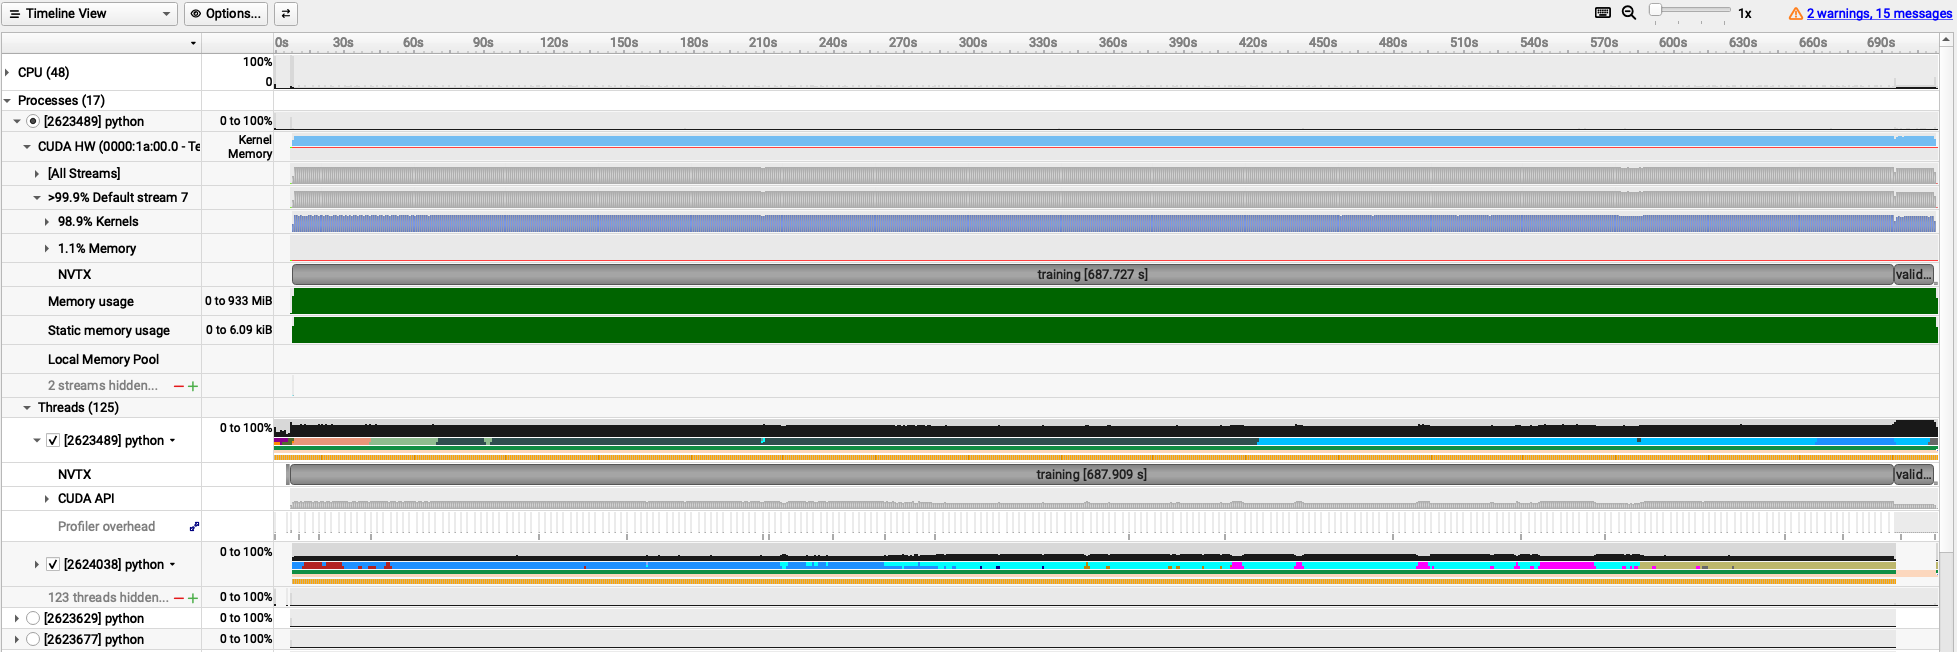
The following trace is obtained for batch_size=4. It shows you various NVTX ranges that were added in the PyTorch script, allowing you to see the time spent in data preparation, training, validation, and model saving phases. If you uncomment the line with #with torch.autograd.profiler.emit_nvtx():, you will also see detailed kernel launches in PyTorch.
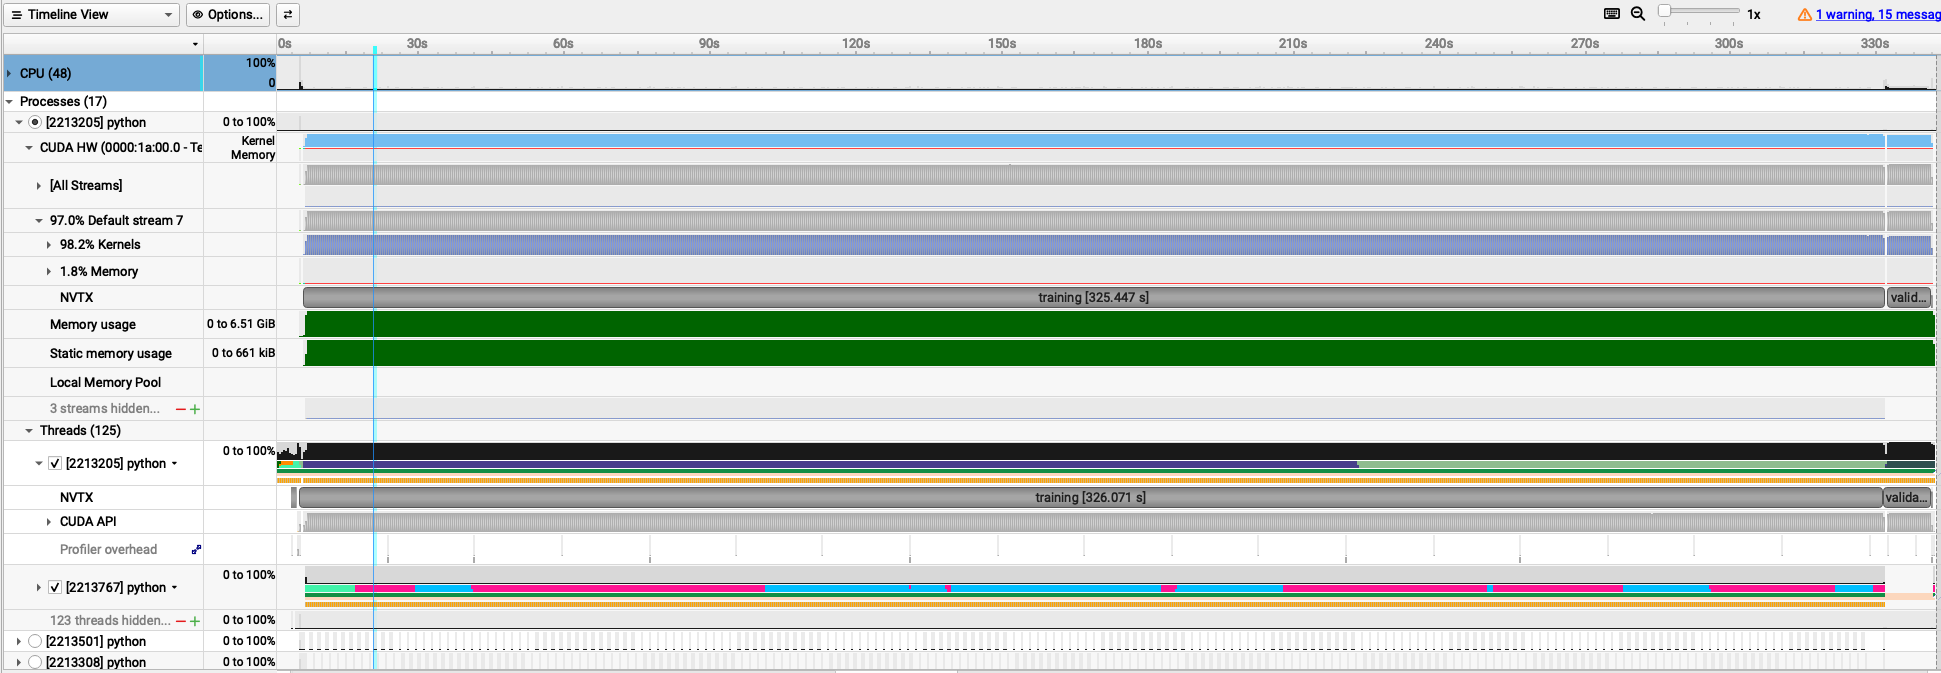
The following trace is obtained for batch_size=64.
On IBEX cluster, GPU performance metrics are automatically collected using NVIDIA Data Center GPU Manager (DCGM) during the execution of a SLURM job. After the job completes, you can check the collected GPU statistics saved under the dcgm directory.
The following output belongs to batch_size=4 job.
The SM Utilization (%) shows the percentage of time during which the GPU’s Streaming Multiprocessors (SMs) were active.
A Streaming Multiprocessor (SM) is the fundamental, hardware-level processing unit within an NVIDIA GPU that executes CUDA thread blocks in parallel.
The Memory Utilization (%) indicates the percentage of GPU memory that was utilized during the job execution.
$ cat dcgm/singlegpu.slurm/43674721/dcgm-gpu-stats-gpu213-14-43674721.out
Successfully retrieved statistics for job: 43674721.
+------------------------------------------------------------------------------+
| GPU ID: 3                                                                    |
+====================================+=========================================+
|-----  Execution Stats  ------------+-----------------------------------------|
| Start Time                         | Mon Jan  5 16:32:39 2026                |
| End Time                           | Mon Jan  5 16:54:49 2026                |
| Total Execution Time (sec)         | 1329.78                                 |
| No. of Processes                   | 1                                       |
+-----  Performance Stats  ----------+-----------------------------------------+
| Energy Consumed (Joules)           | 156500                                  |
| Power Usage (Watts)                | Avg: 119.23, Max: 195.217, Min: 41.848  |
| Max GPU Memory Used (bytes)        | 1394606080                              |
| SM Clock (MHz)                     | Avg: 910, Max: 1530, Min: 135           |
| Memory Clock (MHz)                 | Avg: 877, Max: 877, Min: 877            |
| SM Utilization (%)                 | Avg: 43, Max: 83, Min: 0                |
| Memory Utilization (%)             | Avg: 15, Max: 30, Min: 0                |
+------------------------------------------------------------------------------+
The following output belongs to batch_size=64 job:
$ cat dcgm/singlegpu.slurm/43673584/dcgm-gpu-stats-gpu214-14-43673584.out
Successfully retrieved statistics for job: 43673584.
+------------------------------------------------------------------------------+
| GPU ID: 6                                                                    |
+====================================+=========================================+
|-----  Execution Stats  ------------+-----------------------------------------|
| Start Time                         | Mon Jan  5 15:32:18 2026                |
| End Time                           | Mon Jan  5 15:39:41 2026                |
| Total Execution Time (sec)         | 442.62                                  |
| No. of Processes                   | 1                                       |
+-----  Performance Stats  ----------+-----------------------------------------+
| Energy Consumed (Joules)           | 89504                                   |
| Power Usage (Watts)                | Avg: 208.35, Max: 304.634, Min: 42.394  |
| Max GPU Memory Used (bytes)        | 7409238016                              |
| SM Clock (MHz)                     | Avg: 1228, Max: 1530, Min: 135          |
| Memory Clock (MHz)                 | Avg: 877, Max: 877, Min: 877            |
| SM Utilization (%)                 | Avg: 72, Max: 99, Min: 0                |
| Memory Utilization (%)             | Avg: 47, Max: 67, Min: 0                |
+------------------------------------------------------------------------------+
Comparing the two runs, you can observe that increasing the batch size leads to higher GPU utilization (SM Utilization (%) in the DCGM output) and memory usage (Memory Utilization (%) in the DCGM output), resulting in a more efficient training process.
GPU and memory utilization throughout the execution time of the job can also be observed in the Nsight Systems trace.
This profiling information can help you make informed decisions about optimizing your PyTorch training workloads on NVIDIA GPUs.
Note
NVIDIA Nsight Systems profiling results and DCGM output are available only for successfully completed jobs. If a job fails, these outputs may not be generated or may be incomplete. Always ensure that your training script runs without errors to obtain accurate profiling data.